


1401, Block B, Jinyu International Center, Changping District, Beijing
Views: 0 Author: Site Editor Publish Time: 2026-09-02 Origin: Site


Building a home lab or media center usually begins by looking at hardware costs. You quickly realize the electricity bill dictates your actual long-term expenses. Running robust equipment continuously adds up incredibly fast over a year. Evaluating hardware requires moving past standard manufacturer specifications. You cannot rely on metrics like Thermal Design Power to calculate actual 24/7 wall-draw. A cheap used enterprise rig can easily cost more in annual utility bills than its initial purchase price.
These hidden electricity drains trap many enthusiastic builders. Understanding real-world server power consumption is the critical final step. You must analyze this data before finalizing a hardware purchase or planning an infrastructure rollout. We will break down how different component categories impact your monthly utility bill. You will also learn practical ways to calculate and optimize these ongoing operational expenses.
Idle State is Everything: Home servers typically spend 90%+ of their time idling; evaluating idle wattage is more critical than peak load.
Hardware Class Dictates Baseline: Consumption ranges drastically from 10W (Mini PCs) to 150W+ (used enterprise rackmounts).
Hidden Drains: Spinning hard drives, PCIe expansion cards, and inefficient power supplies often prevent systems from reaching low power states (C-states).
Infrastructure Requirements: Accurate power calculations dictate secondary investments, specifically Uninterruptible Power Supply (UPS) sizing and cooling.
Manufacturers always advertise the Thermal Design Power (TDP) for processors. Many buyers mistake this number for total electrical consumption. TDP actually measures heat dissipation under typical heavy workloads. It only serves as a guideline for selecting coolers. A processor carrying a 65W TDP might pull 150W during short turbo boosts. It could also idle beautifully at just 5W.
You must also remember the processor operates alongside other components. Motherboards, memory modules, cooling fans, and storage drives all require electricity. Total system draw from the wall always exceeds the processor TDP. You need comprehensive numbers to make informed hardware choices.
Many administrators assume heavy processing loads cause high utility bills. Reality proves otherwise for home network setups. Home networks rarely push equipment to full utilization continuously. Your machine likely sits idle for 90% of the day. It waits patiently for someone to stream a movie or sync a file.
Evaluation must focus on idle power consumption. A machine idling at 120W runs up your bill every single hour. A system peaking at 200W but idling at 30W saves you substantial money. You should prioritize idle efficiency over peak performance metrics for home deployments.
Processors use specific energy-saving modes called C-states. These states range from C0 (fully active) down to deep sleep levels. The processor drops its voltage and frequency when inactive. Achieving deep C-states remains the primary goal for energy-efficient administration. You want the CPU to sleep deeply during network downtime. This drops system wattage significantly. Hardware selection directly impacts whether your system can reach these deep sleep modes.
Home Server Hardware Category Comparison
Hardware Category | Expected Idle Draw | Primary Use Cases | Main Limitations |
|---|---|---|---|
Micro-Servers (SBCs/Mini PCs) | 5W - 20W | Docker, Home Assistant, VPNs | Limited storage and PCIe expansion |
Custom Consumer-Grade (NAS) | 30W - 80W | Media streaming, file sharing, backups | Higher initial build cost |
Enterprise Rackmounts | 100W - 300W+ | High-core virtualization, heavy labs | Loud, hot, extremely expensive to run |
Single Board Computers (SBCs) and Mini PCs offer incredible efficiency. You can expect these devices to pull between 5W and 20W at the wall. They utilize mobile-grade processors designed for battery preservation. This makes them perfect for always-on lightweight services.
They handle Docker containers flawlessly. They run Home Assistant locally without breaking a sweat. Lightweight network services like DNS filtering thrive on this hardware. However, they do carry distinct limitations. You cannot add multiple mechanical hard drives easily. You also lack PCIe lanes for high-speed networking cards. They fit specific roles perfectly but struggle as bulk storage arrays.
Many users build custom rigs using standard desktop components. We call these whitebox servers or custom NAS systems. You can expect 30W to 80W at the wall during idle periods. This category offers the absolute best balance of energy efficiency and scalability.
They handle demanding media streaming applications gracefully. They manage local file sharing across dozens of drives. The key variable here involves your mechanical hard drives. Each spinning drive typically adds 5W to 7W of continuous draw. A ten-drive storage array automatically adds 50W to your baseline idle consumption. You must plan your storage topology carefully to maintain efficiency.
Used enterprise gear floods the secondary market constantly. Older dual-socket systems look incredibly tempting on paper. They boast massive amounts of RAM and high core counts. However, you can expect 100W to 300W+ just sitting idle at the wall. Dual redundant power supplies pull phantom wattage constantly. Multiple cooling fans scream at high RPMs.
These machines target high-core-count virtualization environments. They excel in heavy computational labs. The risk factor involves severe bill shock. The low upfront purchase cost traps buyers. Continuous energy draw and massive cooling demands outweigh those initial savings almost immediately. You should avoid these unless you strictly require enterprise-grade features.
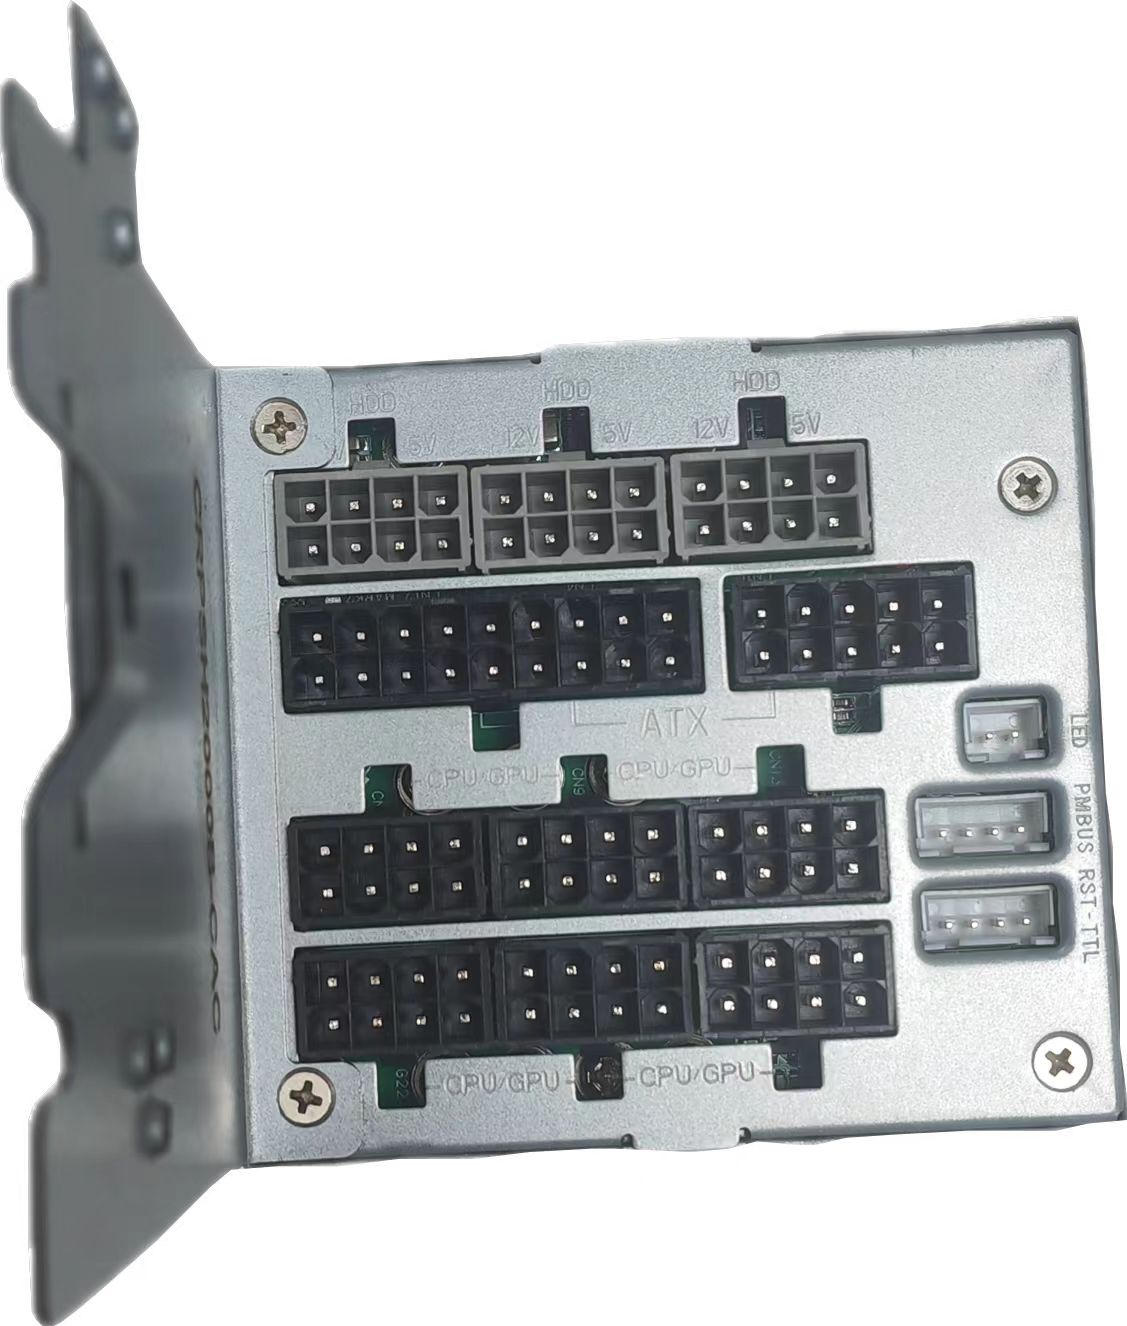
You need a reliable way to project future utility bills. Prospective buyers should always run these numbers before purchasing parts. The standard calculation framework requires just a few basic steps.
Determine the average wattage of your machine.
Multiply this wattage by 24 hours to find daily watt-hours.
Multiply the daily result by 30 days for the monthly total.
Divide this number by 1000 to convert watt-hours into Kilowatt-hours (kWh).
Multiply your monthly kWh by your local electricity rate.
Let us run a realistic scenario using this formula. We will evaluate a 60W custom build running continuously. First, we multiply 60W by 24 hours. This equals 1440 watt-hours daily. Next, we multiply 1440 by 30 days. This gives us 43,200 watt-hours monthly. We divide by 1000 to get 43.2 kWh per month.
Now we apply regional utility rates. An average US utility rate sits around $0.16 per kWh. Multiplying 43.2 by $0.16 equals $6.91 monthly. European utility rates often run much higher, around $0.35 per kWh. Multiplying 43.2 by $0.35 equals $15.12 monthly. Location drastically changes your financial reality.
You must look beyond a single month of operation. Challenge yourself to multiply that monthly cost by 36 months. This reveals the true long-term financial impact of your shortlisted hardware. A 200W enterprise rig costing $50 a month adds $1,800 to your utility bill over three years. A 40W custom build costing $10 a month adds only $360. Calculating real-world server power consumption forces you to confront these hidden expenses.
Many builders purchase massive power supplies unnecessarily. They assume a 1000W unit offers better future-proofing. However, power supplies operate on specific efficiency curves. A 1000W PSU running a 40W system operates at terrible efficiency levels. You might pull 60W from the wall just to deliver 40W to your components.
You should evaluate 80 PLUS Gold or Platinum certifications closely. Look at their efficiency ratings at 10% and 20% loads. Buying an appropriately sized 400W Gold unit saves significantly more energy than an oversized 1000W Titanium unit. Right-sizing the PSU keeps baseline waste minimal.
Expanding your system often breaks processor sleep states. Adding Host Bus Adapters (HBAs) prevents the motherboard from reaching deep C-states. Installing 10GbE network cards triggers the same issue. Older graphics cards block power management features completely.
Active State Power Management (ASPM) dictates how PCIe devices behave. Many enterprise cards refuse to enter low-power modes. They force the processor to stay awake and ready. This artificially inflates idle consumption by 20W to 40W. You should research ASPM compatibility before buying expansion cards.
Storage choices create a massive dilemma for administrators. Spinning down mechanical hard drives saves substantial energy. A spun-down drive pulls less than 1W. However, constant spin-up and spin-down cycles cause mechanical wear-and-tear. Drives fail faster under these harsh thermal cycles.
Investing in all-SSD arrays solves the energy problem. Solid-state drives idle at fractions of a watt. They require higher upfront capital expense. They deliver lower operational expense over time. You must weigh the upfront premium against long-term utility savings.
Measuring energy draw isn't just for predicting utility bills. It remains absolutely mandatory for specifying an Uninterruptible Power Supply (UPS). You need exact numbers to protect your equipment during outages. Guessing your wattage often leads to undersized battery backups. The battery fails immediately when grid electricity drops. This crashes your storage array and corrupts active data.
You should never size a UPS based purely on idle numbers. Your system experiences massive spikes during specific events. Mechanical drives pull double their normal wattage during initial spin-up sequences. Processors spike to maximum TDP during boot cycles.
We advise sizing a UPS for 20% to 30% above your absolute peak load. If your system peaks at 300W under maximum stress, buy a unit rated for at least 400W. This headroom handles drive spin-ups and CPU bursts effortlessly during sudden grid fluctuations.
Modern equipment requires specific power delivery formats. Active Power Factor Correction (PFC) power supplies dominate the market today. They expect smooth electrical waveforms from the wall. You must buy pure sine wave UPS systems to match this requirement.
Cheaper simulated sine wave backups cause massive problems. Active PFC supplies detect the choppy simulated wave as a fault. They shut down instantly to protect internal components. Buying the wrong backup unit defeats the entire purpose of having one.
Evaluating hardware requires a strict focus on operational reality rather than peak potential. Your monthly utility bill quickly exposes inefficient setups. You must approach your final build decisions strategically.
Focus on Idle: Base your purchasing decisions heavily on known idle wattage metrics rather than peak performance numbers.
Right-Size Components: Avoid oversized power supplies and unnecessary enterprise expansion cards to preserve deep processor sleep states.
Calculate Long-Term Expenses: Always project your monthly utility cost across three years to see the full financial picture.
Protect Properly: Use accurate peak wattage calculations to buy appropriately sized pure sine wave battery backups.
For most home users, modern consumer silicon offers the best performance-per-watt ratio. We strongly recommend buying a physical wall meter like a Kill A Watt. Alternatively, purchase a reliable smart plug featuring energy monitoring. Baseline your current hardware before purchasing new equipment. Accurate data remains your best tool for building an efficient home network.
A: It depends on your storage volume. Large storage arrays run much cheaper at home. Renting terabytes of cloud storage costs a fortune monthly. Conversely, hosting a simple website runs cheaper in the cloud. A basic cloud instance costs less than the monthly electricity required to keep a home machine powered on 24/7.
A: We generally advise against daily power cycling. Components experience thermal expansion and contraction during power cycles. This daily thermal shock accelerates mechanical wear on hard drives and motherboards. Additionally, most machines perform critical background tasks like backups and data scrubbing overnight. Leaving them on is usually safer.
A: Yes. Modern SATA SSDs typically consume 1W to 2W under active load. They idle at mere fractions of a watt. Traditional 3.5-inch mechanical drives pull 5W to 7W constantly while spinning. Replacing eight mechanical drives with SSDs easily drops your baseline system consumption by 40W to 50W.
A: Software tools provide decent estimates but often miss external factors. IPMI dashboards and software utilities cannot measure power supply inefficiency. They only see component demand. Hardware at-the-wall measurement remains the only verifiable truth. A physical meter captures every watt pulled from your grid, including power supply conversion losses.